

The Dynamic Replenishment solution consists of four key components:
- Centralization of inventories
- Development of inventory targets based on replenishment time
- Absorption of variation in demand and supply by strategic buffers
- Synchronization of supply flow achieved through a focus on the status of inventory pulled into the system over time
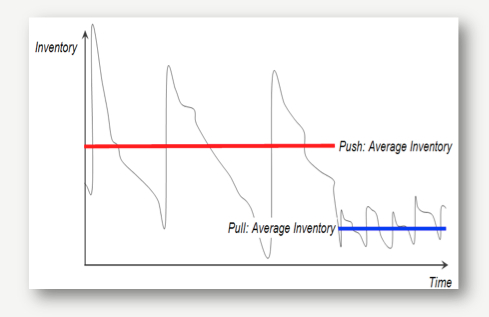
For most organizations, once product is pushed out into the channel, it is very difficult to move it to another location if that inventory is required somewhere else. This is typically due to IT system limitations, local hoarding of inventory, or, most commonly, the cost associated with cross-shipping. Often sites requiring more products prefer to simply order more, rather than cross-ship, which results in increased total system inventory.
In the Dynamic Replenishment framework, a central warehouse is used to service regional warehouses and/or consumption points, giving organizations the ability to serve inventory to the locations that need it most based on actual consumption. Another benefit of establishing a central warehouse in the Dynamic Replenishment framework is to absorb demand variability. Variability in consumption is highest at consumption locations. By introducing a central warehouse that serves multiple locations, variability is actually reduced. Since the demand from a supply point is the aggregated consumption of all the points it feeds, statistical fluctuations average out. So, as the number of consumption points the central warehouse serves increases, the variability at the central warehouse decreases. This results in the central warehouse holding more than the inventories at all the regional warehouses combined. However, the total system inventory is typically reduced significantly.
The next step in the Dynamic Replenishment solution is to develop inventory targets at each point in the supply chain, for each item based on both consumption and replenishment. The target should be based on maximum consumption of each SKU within the average replenishment time, factored by the level of unreliability of the replenishment time. The parameters used to determine the initial inventory target are:
- Consumption rate
- Variability in consumption
- Replenishment time
- Variability in replenishment time
It is important not to worry too much about determining the initial inventory targets. Once the system starts pulling SKUs, targets will dynamically adjust to meet demand requirements.
Once targets are in place, the move to pull inventory based on consumption and frequent replenishment can begin in earnest. To do so, the management of strategic buffers is imperative. Zone charts are used to manage buffers in order to absorb demand and supply variation, allowing the monitoring of inventory targets periodically.
Let's consider an example: the number of supplies of surgical sutures that we want to hold at our hospital. Suppose that we determined that the replenishment time (transportation lead time) from the East Coast warehouse to our hospital is 3 days, and that the maximum consumption within that 3 day lead time, plus a factor for variability within the lead time, is 333 units. The target of 333 is now broken into 3 zones with each zone equal to 1/3 of the inventory target. The zones are colored, red, yellow and green. So in following zone chart, the red zone represents 0 to 111 units, the yellow zone equals 111 to 222 and the green zone equals 222 to 333.
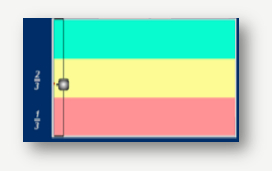
There are two additional features to note: first the bottom of the red zone equals zero, a stock out, and second, the top of the green zone represents the inventory target of 333 units. The goal is to always replenish to the target.
The red zone represents a low inventory level, the yellow zone corresponds to an adequate inventory level and the green zone signifies a high inventory level. If during a period equal to the replenishment time, the inventory level penetrates either the red or green zones, the target should be adjusted. The target will increase or decrease by 33%, depending on which zone the inventory level is in.
Now to consider this example with the Dynamic Replenishment solution implemented over time where the consumption of surgical sutures doubles within the period of one week, replenishment time is three days and the frequency of delivery is daily [2].
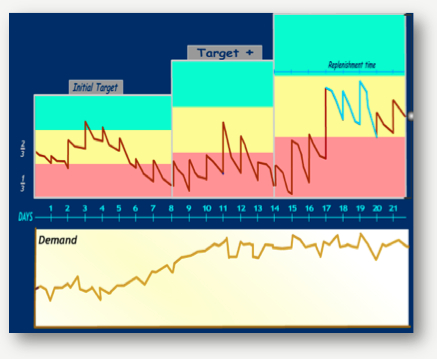
During the first day, some item is consumed. Replenishment for the first day of consumption comes at day four and is represented by the up spike in the inventory line. On day five, the inventory line begins to penetrate the red zone. Since it stays there for a time representing one replenishment period, the target is adjusted by 33%, resulting in a new target inventory level. For example, let’s say that the initial target was 333 units of surgical sutures represented at the top of the green zone. With the new adjustment, the new target will be 444 units. But, as can been seen from the preceding zone chart, this increase was not adequate due to further growth in demand. The inventory target needed to increase again, which was presaged by the penetration into the red zone. The new target is now 592 units and this new adjustment appears to be correct, based on the trending of the inventory line in the yellow zone, which represents a sufficient level.
Now let's look at an actual live example:
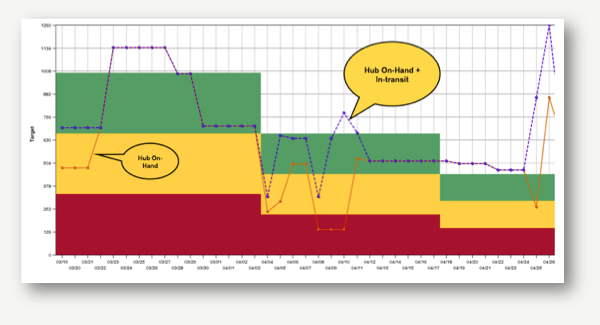
Notice there are two lines, an orange line and a blue line. The orange line represents actual inventory at the hub. The blue line represents inventory that is on hand at the hub plus what is in transit, a 'virtual buffer' to meet demand. The initial inventory target was set to 1,000 units, but as the zone chart illustrates, this was too high, so the target dynamically adjusted down to 700 units. However, this too was not enough, so the target adjusted down to approximately 475 units.
Two interesting things have happened on this chart. First, on 3/23, the inventory line went outside the green zone. This happened because the Account Manager overrode the system and sent additional units to the hub. This is an additional benefit of the Dynamic Replenishment solution: it allows the monitoring of instances when Account Managers override the system. In other words, it adds accountability for Sales and Account Management. Second, on 4/25, the inventory shot up at the hub. This resulted from a system override due to a sales promotion at one of the retail stores this chart represents. When the inventory level is outside of the green zone, the system knows not to adjust the inventory level because this is more than likely a promotion or special circumstance of some kind.
Follow Us: